To evade detection by antivirus software, malware uses a number of techniques to prevent its true purpose from being discovered. One common method is to hide its contents through the use of packer or crypter software.
In this Redscan Labs article, we examine the process required to remove a packing routine from an executable in order to conduct static malware analysis.
What is a software packer?
Software packers function by compressing the contents of a program and, in the process, inserting into it a decoder stub for decompression.
Packers can be used for legitimate purposes, to decrease the size of an executable file, however are also commonly used by malware authors to evade signature-based security detection. The majority of antivirus software does not scan system memory so if malicious code is unpacked or decrypted in memory it is unlikely to be detected.
The use of packers makes performing static analysis difficult as the original underlying program will be obfuscated while it remains in packed form.
Removal of packing software involves the following steps:
- Verifying packer usage
- Determining a program’s Original Entry Point (OEP)
- Dumping the uncompressed executable from memory to disk
- Reconstructing a program’s Import Address Table (IAT)
1. Verifying software packer usage
Microsoft Windows uses a standard file format for programs, known as Portable Executable (PE). The screenshot below shows an executables section table for an unpacked program.
Note: Viewing a program’s excutable table requires installation of a PE detection tool. In this example we use PEid.
Data is stored in different sections to allow for various levels of memory protection. For instance, the .text section, which holds program code, would have execute and read-only permissions, whereas the .data section, which holds global variables, would only have read/write permissions.
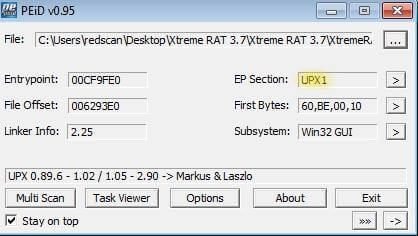
The next image shows sections of an executable that have been packed. The limited number of sections is suspicious. Section names UPX0 and UPX1 provide a good indication that UPX packing software has been used.
In this example, PEiD confirms the usage of the UPX packing routine, and shows the program’s Entry Point (EP), where it will commence code execution – 00CF9DE0. Other signs of a packer being used could include a low number of imported sections and use of LoadLibraryA and GetProcAddress, which are widely used by packers. Another indicator of packer usage is that the executable image on disk will have a high degree of entropy and a small number of text strings.

2. Determining a program’s OEP
In this example, the packer has changed the program’s entry point to its decoder stub. To find the Original Entry Point (OEP), we run the program in a debugger for a step through execution. On initialisation, the program stores the current register status using a PUSHAD instruction, as seen in the screenshot below.

The next step is to set a hardware breakpoint on the Extended Stack Pointer (ESP) register address to reach the unpacking stub. This section of code unpacks the original executable’s code to memory, then executes a JMP instruction to return to the program’s OEP.
Next, we set a software breakpoint on the JMP instruction to allow the unpacking routine to execute and step through to reach the OEP.

Now the original code has been unpacked in memory it’s possible to determine the address of the Original Entry Point (0086A810).

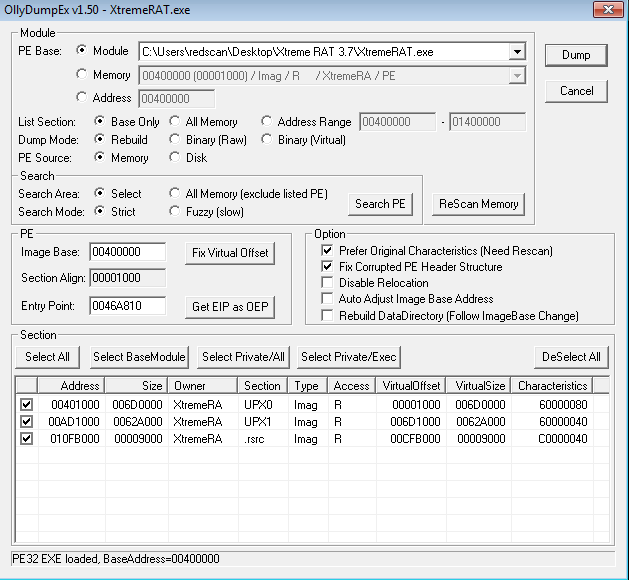
We can now use OllyDumpEx to dump the process, using the OEP address we previously uncovered.

In order to produce a working executable, the next step to perform is reconstruction of the Import Address Table (IAT).
3. Understanding the IAT
When a program is first executed, the Windows loader reads the PE structure and loads the executable to memory. The IAT is a component of the PE file listing the dynamically linked libraries (DLL) loaded by the program and the functions required from each DLL.
The function addresses within a DLL might change as new DLL versions are released so programs cannot use static function addresses. Because of this, the operating system completes the IAT when a program is executed.
The below image shows the Import Address Table viewed within a debugger:

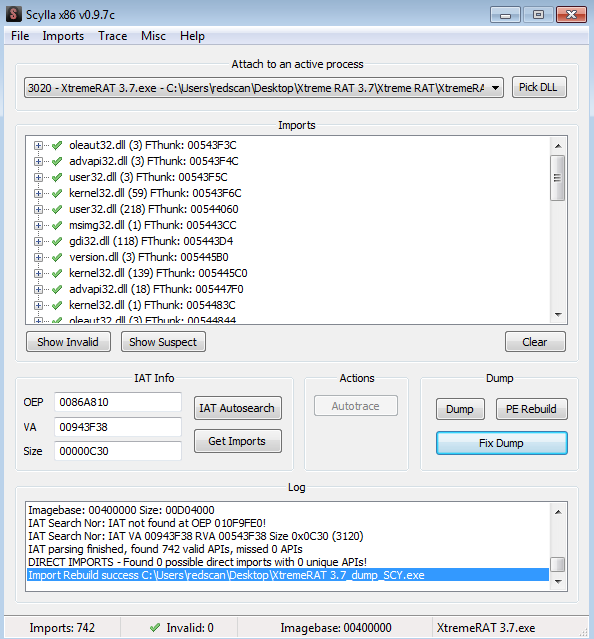
Scylla is a tool that can be used to reconstruct the IAT. This attaches to the currently running process. Supplying the OEP address enables us to determine, via a debugger, that the memory dump’s IAT table can be fixed.

The result of this process is an unpacked executable ready for full static analysis.

About Redscan Labs
Redscan Labs is a specialist hub within our cyber security operations centre dedicated to in-house threat research and analysis. By conducting regular threat investigation, such as in-depth malware analysis, our experts maintain a detailed understanding of the latest malicious actors and use this knowledge to improve our range of award-winning security services. This includes the creation of new signatures and rulesets to improve threat hunting plus detection and response to attacks.
Read more:
An introduction to endpoint security and how it can benefit your business
Why your business needs to adopt a proactive approach to cyber security
The key challenges of intrusion detection and how to overcome them


